The decay caused by leverage is also known as beta-slippage. These terms refer to a relatively simple mathematical concept and explain why leveraged volatility ETFs tend to underperform the underlying index in the long run.
Holding a z-times leveraged ETF is generally worse than holding a z-times leveraged position in the underlying index.
To understand how leverage decay affects a volatility ETF, let’s look at a few examples.
High Volatility in VIX Futures
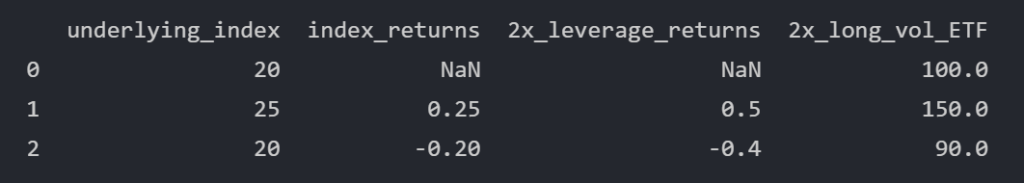
- The underlying index (30-day blend of first and second month VIX futures) of a 2x-leveraged ETF moves from 20 to 25, and then back to 20.
- When the underlying index goes up 25% (from 20 to 25), the 2x leveraged ETF goes up 50%.
- When the underlying index goes down 20% (from 25 to 20), the 2x leveraged ETF goes down 40%.
- Surprisingly (or not surprisingly), the ETF does not go back to $100 but ends up at $90.
This is a 10% loss due to “leverage decay” or “beta slippage” in two days!
Now, let’s see how a 2x leveraged ETF would perform in a situation where the underlying index oscillates between 20 and 25 over the course of 10 trading days.
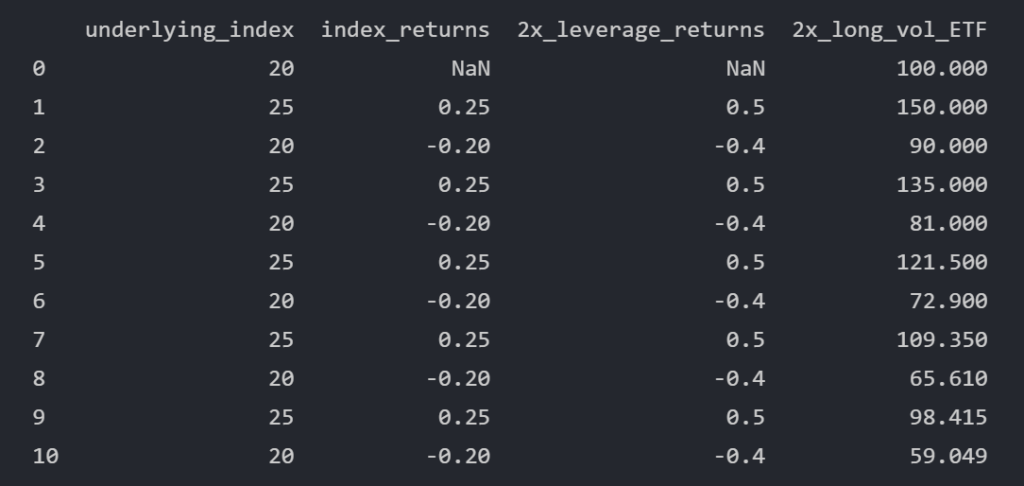
In this hypothetical example, a 2x leveraged ETF would lose 41% of its value within two weeks!
Low Volatility in VIX Futures
Let’s explore what happens if a 2x-leveraged ETF is exposed to smaller moves in the underlying index.
- The underlying index moves from 20 to 20.50, and then back to 20.
- When the underlying index moves up 2.5% (from 20 to 20.50), the 2x leveraged ETF moves up 5%.
- When the underlying index moves down 2.4%, (from 20.50 to 20) the 2x leveraged ETF loses 4.9%.
- The ETF does not return to $100 but drops to $99.88.
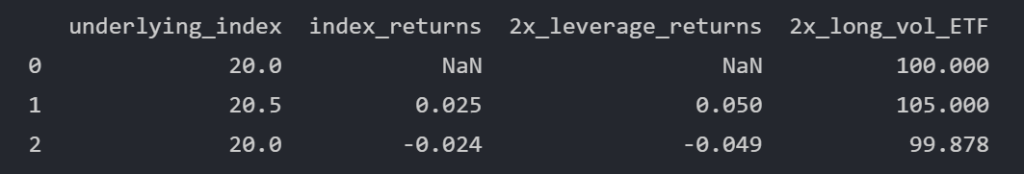
Smaller moves of the underlying index result in significantly smaller decay. There is still some decay, but the magnitude is not as extreme as in the previous example.
Small Moves Up, Big Move Down
Let’s simulate how a 2x leveraged volatility ETF reacts to small upward moves in the underlying index – followed by a large downward move to the starting level.
- The underlying index moves in small steps from 20 to 25, and then drops to 20 in a single day.
- The 2x leveraged ETF reaches $154.76 before going down to $92.86.
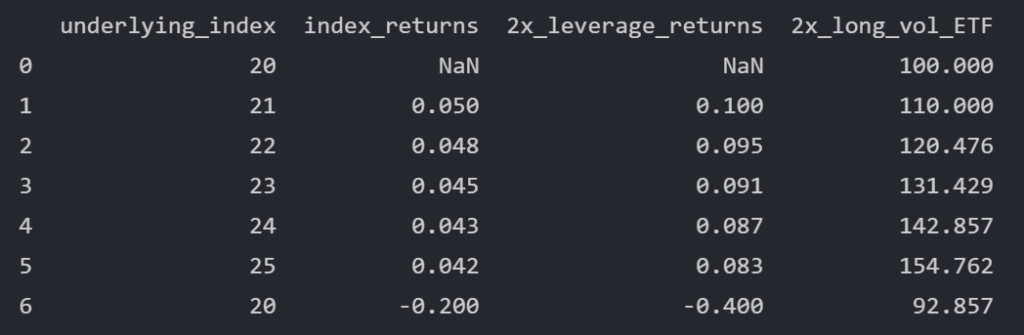
A comparison to the first table shows some important differences:
- When the underlying index moved from 20 to 25 in a single day, the 2x leveraged ETF reached $150.00.
- When the underlying index moved from 20 to 25 over the course of five days, the ETF peaked at $154.76.
- In the single day scenario, the ETF’s final value was $90.00. In the five days scenario, $92.86.
Small upward moves over the course of several days result in a higher peak than a same-magnitude single day move.
The ETF’s final value is higher in the five days scenario, even though in both scenarios the underlying index returns to the same value.
Intuitively, many VIX ETF newbies would expect that the “path” of the underlying index does not result in different ETF peaks and final values.
The academic world, however, has published numerous articles on the so-called path dependence of leveraged ETF returns (for example, Avellaneda and Zhang (2009)).
In general, the path-dependent returns of a leveraged ETF underperform the underlying index. Please see conclusion #3 for an important discussion why leveraged long volatility ETFs are even more affected by the negative effects than typical leveraged stock market ETFs such as UPRO (3x daily returns of SPY).
Small Moves Up, Small Moves Down
Let’s move on to another example where the underlying index moves up in small steps and down in small steps.
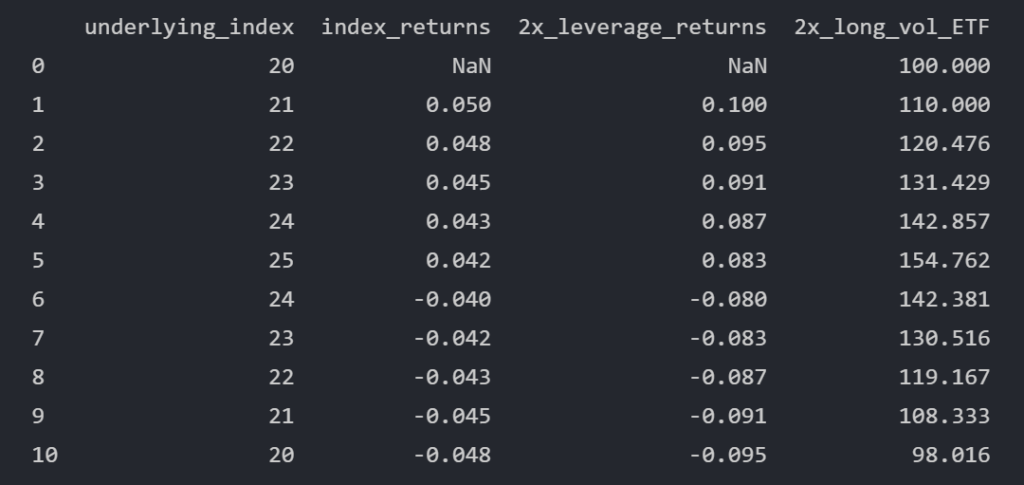
Comparing to the previous table, the following observations can be made:
- Not surprisingly, the 2x leveraged ETF peaked at $154.76 in both scenarios.
- The final value of the ETF came in at $98.02 in the small-moves-up-small-moves-down scenario vs $92.86 in the small-moves-up-big-move-down scenario.
In a nutshell, the 2x leveraged ETF lost around 2% in 10 days. Not as much as in the big move down scenario, but still a significant amount for such a short time period.
Conclusions
- Path dependence makes it impossible to predict how leverage decay will affect the value of an ETF.
- During periods of high volatility in the underlying index, leverage decay can be expected to be large.
- As VIX and consequently its futures are mean-reverting (i.e. VIX returns to its “normal” level after a spike), the impact of beta slippage reduces the value of a leveraged long-vol ETF in the long run.
Regarding conclusion #3, this characteristic is extremely different from equity ETFs (such as SPY) which can trend upward in small steps for extended periods of time. A prime example is the 3x leveraged UPRO:
- UPRO’s annual returns in non-volatile 2013, 2017 and 2021 came in roughly 4x higher than those of SPY.
- In very volatile 2020, however, UPRO’s annual return was 9.8% vs SPY’s annual return of 16.2%.
By the way, beta slippage is not the only source of decay in long volatility ETFs. Very soon we are going to explore contango!